
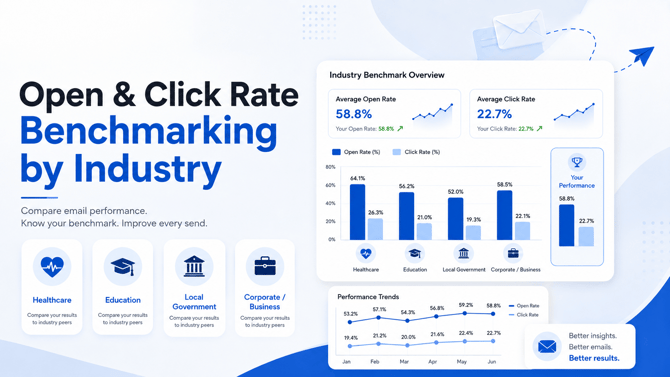
You can see in your Reports how well your emails are performing, however you're often looking at those details in a vacuum.
How do you compare to other NewZapp users?
How do you compare to other users in the same industry? Well NewZapp has the answer!
If you click on Reports on the left hand side, the bottom option is Benchmarking.
When you click in here by default you'll be looking at your data in the current year to date and you can change this with the Benchmark Year drop down box in the top right corner.
Core Metrics
Lets start with the first 3 boxes at the top of the screen, where you can see in 3 boxes what your average Open, Click and Bounce rates for the selected year. You can also see the total number of each and a percentage change compared tot he previous year.

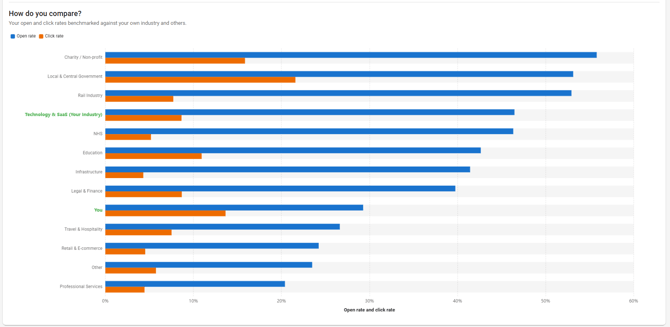
How do you compare?
Beneath that you can see a bar chart showing the average percentage open and click rates for different industries using NewZapp. Your own industry will be shown in green and will say "Your Industry" in brackets and you will also have a separate record for just your account specifically.
If you have any questions about how any of this works, please reach out to your account manager or email support@newzapp.com.